T-test for Paired Samples
Instructions: This calculator conducts a t-test for two paired samples. This test applies when you have two samples that are dependent (paired or matched). Please select the null and alternative hypotheses, type the sample data (or paste it from Excel) and the significance level, and the results of the t-test for two dependent samples will be displayed for you.
If you need a larger sample size click in the button below, or paste directly from Excel
The T-Test For Paired Samples
More about the t-test for two dependent samples so you can understand in a better way the results delivered by the solver.

How do you calculate a paired t-test?
A t-test for two paired samples is a hypothesis test that attempts to make a claim about the population means (\(\mu_1\) and \(\mu_2\)). More specifically, a t-test uses sample information to assess how plausible it is for difference \(\mu_1\) - \(\mu_2\) to be equal to zero.
The test has two non-overlapping hypotheses, the null and the alternative hypothesis. The null hypothesis is a statement about the population parameter which indicates no effect, and the alternative hypothesis is the complementary hypothesis to the null hypothesis. The idea of the test is to assess whether or not there is statistical significance. The main properties of the t-test for two paired samples are:
- The test required two dependent samples, which are actually paired or matched or we are dealing with repeated measures (measures taken from the same subjects)
- As with all hypotheses tests, depending on our knowledge about the "no effect" situation, the t-test can be two-tailed, left-tailed or right-tailed
- The main principle of hypothesis testing is that the null hypothesis is rejected if the test statistic obtained is sufficiently unlikely under the assumption that the null hypothesis is true
- The p-value is the probability of obtaining sample results as extreme or more extreme than the sample results obtained, under the assumption that the null hypothesis is true
- In a hypothesis tests there are two types of errors. Type I error occurs when we reject a true null hypothesis, and the Type II error occurs when we fail to reject a false null hypothesis
How do you manually calculate a paired t-test? What formula do you use?
The formula for a t-statistic for two dependent samples is:
\[t = \frac{\bar D}{s_D/\sqrt{n}}\]where \(\bar D = \bar X_1 - \bar X_2\) is the mean difference and \(s_D\) is the sample standard deviation of the differences \(\bar D = X_1^i - X_2^i\), for \(i=1, 2, ... , n\).
How to use paired t-test formula
- Step 1: First, you need to define what your null and alternative hypotheses are. The choices are two-tailed, left-tailed or right-tailed.
- Step 2: Then, you need to specify your significance level. Typically, you will choose α = 0.05. This is the tolerance you accept to making a type I error
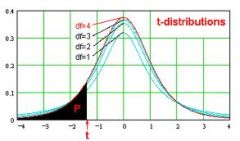
- Step 3: Based on the significance level you chose and the type of tail, you find the critical t-statistics by either looking at a t-distribution table or use a calculator or Excel. Then, you clearly state your rejection region
- Step 4: You compute the t-statistic using the formula specified above t = Dbar/(sd/√n)
- Step 5: Based on the the calculated t-statistic and if it falls in the rejection region or not, you determine whether you reject the null hypothesis or not
- Step 6: Use the conclusion of the t-test to give an interpretation in the context of the setting of the specific problem.
Paired t test example
Question: Assume that you have the following sample of paired data.
| Sample 1 | Sample 2 | Difference = Sample 1 - Sample 2 | |
| 4 | 2 | 2 | |
| 5 | 3 | 2 | |
| 6 | 4 | 2 | |
| 5 | 5 | 0 | |
| 4 | 6 | -2 | |
| 3 | 4 | -1 | |
| 5 | 3 | 2 | |
| Average | 4.571 | 3.857 | 0.714 |
| St. Dev. | 0.976 | 1.345 | 1.704 |
| n | 7 | 7 | 7 |
Can the null hypothesis that the population mean difference is zero be rejected at the .05 significance level.
Solution:
From the sample data, it is found that the corresponding sample means are:
\[\bar X_1 = 4.571\]\[\bar X_2 = 3.857\]Also, the provided sample standard deviations are:
\[ s_1 = 0.976 \]\[ s_2 = 1.345 \]and the sample size is n = 7. For the score differences we have
\[ \bar D = 0.714 \]\[ s_D = 1.704 \](1) Null and Alternative Hypotheses
The following null and alternative hypotheses need to be tested:
\[ \begin{array}{ccl} H_0: \mu_D & = & 0 \\\\ \\\\ H_a: \mu_D & \ne & 0 \end{array}\]This corresponds to a two-tailed test, for which a t-test for two paired samples be used.
(2) Rejection Region
Based on the information provided, the significance level is \(\alpha = 0.05\), and the critical value for a two-tailed test is \(t_c = 2.447\).
The rejection region for this two-tailed test is \(R = \{t: |t| > 2.447\}\)
(3) Test Statistics
The t-statistic is computed as follows:
\[ \begin{array}{ccl} t & = & \displaystyle \frac{\bar D}{s_D/ \sqrt n} \\\\ \\\\ & = & \displaystyle \frac{0.714}{1.704/ \sqrt{7}} \\\\ \\\\ & = & 1.109 \end{array}\](4) Decision about the null hypothesis
Since it is observed that \(|t| = 1.109 \le t_c = 2.447\), it is then concluded that the null hypothesis is not rejected.
Using the P-value approach: The p-value is \(p = 0.31\), and since \(p = 0.31 \ge 0.05\), it is concluded that the null hypothesis is not rejected.
(5) Conclusion
It is concluded that the null hypothesis Ho is not rejected. Therefore, there is not enough evidence to claim that the population mean difference \(\mu_D = \mu_1 - \mu_2\) is different than 0, at the \(\alpha = 0.05\) significance level.
Confidence Interval
The 95% confidence interval is \(-0.862 < \mu_D < 2.291\).
What is the non-parametric alternative of the paired t-test?
This is a parametric test that should be used only if the normality assumption is met. If it fails, you should use instead this Wilcoxon Signed Ranks test . This paired t-test calculator deals with mean and standard deviation of pairs.
Other t-test applications
Often times you have two samples that are not paired, in which case you would use a t-test for two independent samples calculator. Notice that in that case the samples don't have to necessarily have the same size.

