Calculator of Mean And Standard Deviation for a Probability Distribution
Instructions: You can use step-by-step calculator to get the mean \((\mu)\) and standard deviation \((\sigma)\) associated to a discrete probability distribution. Provide the outcomes of the random variable \((X)\), as well as the associated probabilities \((p(X))\), in the form below:
Mean And Standard Deviation for a Probability Distribution
More about the Mean And Standard Deviation for a Probability Distribution so you can better understand the results provided by this calculator. For a discrete probability, the population mean \(\mu\) is defined as follows:
\[ E(X) = \mu = \displaystyle \sum_{i=1}^n X_i p(X_i)\]On the other hand, the expected value of \(X^2\) is computed as follows:
\[ E(X) = \mu = \displaystyle \sum_{i=1}^n X_i p(X_i)\]and then, the population variance is :
\[ \sigma^2 = E(X^2) - E(X)^2\]Finally, the standard deviation is obtained by taking the square root to the population variance:
\[ \sigma = \sqrt{E(X^2) - E(X)^2}\]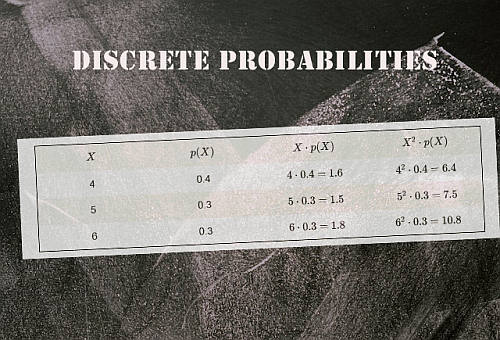
Discrete Versus Continuous Distributions
The formulas presented above only work for discrete distributions, which are distributions, which are distributions that their outcomes can be enumerated as x1, x2, x3, ...., etc. For example, if you cast a dice, you can get 1, 2, 3, 4, 5 or 6, which is an example of an discrete random variable.
On the other hand, say that you take a random eight grader and measure her height, you will get a random value from a list of potential values that cannot be enumerated. For example, the normal distribution calculation is an example of a calculation you would do with a continuous distribution, for which the formulas presented above would not apply.

